
Pareto analysis helps teams focus on the categories that account for the largest share of a problem. It is one of the most practical prioritization tools in quality and operations because it shows where attention will likely produce the largest return.
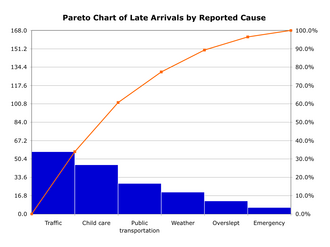
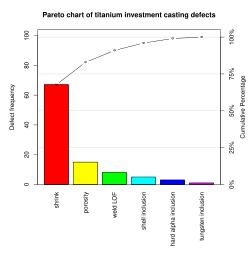
Pareto Chart Visual References
These examples show the two most common uses of Pareto logic: a simple prioritization chart and a manufacturing defect chart that makes the dominant category impossible to miss.
Core Concept
The principle is often described as the “vital few and trivial many.” It does not mean 80/20 is always exact. It means a small number of causes often account for a large share of the effect.
How to Build a Pareto Chart
- Define the problem category you want to study.
- Collect frequency, cost, time, or impact data by category.
- Sort categories from largest to smallest.
- Calculate cumulative percentage.
- Plot bars plus the cumulative line.
Worked Example
Suppose a production line logged 220 defects last month across five categories: label errors, connector damage, missing hardware, cosmetic scratches, and failed functional tests. A simple frequency Pareto might show that label errors and connector damage make up most of the count. That tells the team where to begin, but it does not yet tell them the root cause.
A stronger analysis adds context. If connector damage is less frequent but creates higher scrap cost and customer risk, a cost-weighted Pareto may move it ahead of label errors. If label errors happen mostly on one shift or one product family, stratification changes the improvement plan. Pareto is most useful when it helps the team choose the right problem, not merely the tallest bar.
Choosing the Right Pareto Basis
| Basis | Use When | Risk If Misused |
|---|---|---|
| Count | The number of events is the main burden. | Frequent low-impact issues may crowd out severe problems. |
| Cost | Scrap, rework, warranty, or downtime dollars drive the decision. | Rare expensive events may hide systemic daily friction. |
| Time | Delay, queue, setup, or downtime is the primary loss. | Short but safety-critical issues may appear unimportant. |
| Severity or risk | Customer exposure, compliance, safety, or escape risk matters most. | Teams may over-focus on severe but poorly defined categories. |
| Customer impact | Complaints, returns, or service disruption are the key concern. | Internal waste may remain invisible unless paired with cost data. |
Stratification Questions
Before launching a corrective action, slice the data to see whether the pattern changes. Many teams waste time because the overall Pareto hides a sharper signal underneath. Useful stratification questions include:
- Does the top category change by shift, line, operator group, supplier, machine, tool, model, or revision?
- Does the issue cluster after changeover, after maintenance, during startup, or near the end of the shift?
- Does the pattern change when measured by cost instead of count?
- Are categories defined cleanly enough, or do they mix unrelated failure modes?
- Is the top category too broad, requiring a second-level Pareto?
From Pareto to Action
A Pareto chart should trigger deeper analysis, not become the entire project. Once the vital few are identified, the team should move into a method such as fishbone analysis, 5 Why, process observation, capability review, or experiment planning. The selected action should target a verified cause, and the Pareto should be refreshed after implementation to confirm that the pattern moved.
If the largest bar drops but total defects remain the same, the system may have shifted failure modes rather than improved. If the entire distribution drops, the action likely addressed a broader process weakness.
Where Pareto Works Best
- Defect type prioritization
- Complaint category review
- Downtime reason ranking
- COPQ driver analysis
- Scrap or warranty spend breakdown
Frequency vs. Cost Pareto
Not all Pareto studies should use count alone. A frequent small issue may matter less than a less frequent but much more expensive issue. Teams should choose the right impact basis: count, minutes lost, dollars, severity, or customer impact.
Common Mistakes
- Using poor category definitions that mix unlike issues
- Ignoring stratification by shift, line, part family, or supplier
- Treating the largest category as a proven root cause rather than a starting point for analysis
- Failing to refresh the Pareto after improvements shift the pattern
Final Takeaway
Pareto analysis is not a root-cause tool by itself. It is a focus tool. Used well, it tells teams where to look first so their root-cause work starts with the highest-value problem categories.
Apply This Next
Try the Lean 5-Why Root Cause Tool
Use 5 Why on the highest-impact category once Pareto has identified the vital few.
Read the Fishbone Guide
Expand the investigation when the top Pareto category has multiple plausible cause families.
Use the Cost of Poor Quality Estimator
Translate the biggest defect categories into cost so prioritization is financially grounded.